In the current economic policy debate in Europe there seems to be an increasing polarization between the German view and the view of the other countries. How did we end up with such polarized views of the world? What is the basis for the apparent German stubbornness to change their mind about what are the right economic policies for the Euro area? Here is my best attempt to explain the economic logic behind that side of the debate, including a critical view of the arguments whenever is needed.
1. Europe needs structural reforms. Correct, this has always been true and it will be true in the coming years or decades.
2. Some countries/governments will find any excuses they can to avoid reforms. Correct. Without external pressure or a crisis, change will not happen. This was also true for Germany in the post-2000 reforms.
3. Imbalances of spending and debt (and asset price bubbles) were a fundamental cause of the crisis. Correct.
4. The pre-crisis imbalances requires post-crisis sacrifices. Correct but only up to a point. We understand that deleveraging can slow down growth but this does not justify the extent of the Euro crisis. For example, the fact that pre-crisis growth was not balanced and required an adjustment does not justify the post-crisis downward revisions that we have seen of potential output in many Euro members.
5. Competitiveness and low wages are the key to growth. Wrong. Prices need to reflect the balance of supply and demand and while it is possible that in some cases some prices or wages are above their optimal levels the idea that reduction in nominal wages leads to growth is wrong. It just leads to deflation. And the idea that reduction in real wages is always good makes no sense. If this was true, let's all work for free to be more competitive. In addition, reduction in wages look a lot like competitive devaluations that we know are not possible everywhere.
6. Good behavior, high saving and a surplus in the current account are a sign of strength. Wrong. Not every country can run a current account surplus. The world cannot save (net of investment).
7. Inflation is always bad. Wrong. Even the Bundesbank always understood that 0% inflation was not optimal. All central banks around the world set inflation targets above 0% for a reason. Questioning 2% as a target and arguing for 3% or 4% (permanently or temporarily) is consistent with the framework central banks use to think about inflation.
8. Germany can live without the Euro, it has only been a source of costs for the economy. Germany will certainly be a successful economy without the Euro but so far Germany is one of the countries that has benefitted the most from the creation of the Euro.
9. Demand does not matter, the only thing that matters is supply and structural reforms. Wrong. Recessions are a reality and some of them are driven by a deficiency in demand. While it will still be true that reforms are needed (see point #1), in the short-term policy should be focused on demand. And what matters for the short run (spending) might be different than what matters for the long run (saving and investment).
So that's how we ended up with a policy that is based on the idea that pre-crisis excesses justify any post-crisis suffering. That assumes that whatever output drops we see are the consequence of the imbalances that led to the crisis and the absence of reforms. That refuses to debate about inflation despite the agreement among central banks that 0% inflation is never optimal. That is willing to gamble with the political consequences of discontent in some Euro countries even if they lead to yet another crisis and possibly a break up of the Euro zone.
Antonio Fatás
Tuesday, December 2, 2014
Monday, November 24, 2014
Is 0% growth for 90% a successful economic model?
Via Greg Mankiw I read the review of Piketty's book by Deirdre McCloskey. The review reminds me of the conversations I have in my class when I bring up the issue of income inequality. While most people express initial concerns about recent trends of increasing inequality, there tends to be a negative reaction about accepting that this is indeed a failure of our current economic model and most become very defensive when that argument is being made.
I do not want to discuss the details of the review but more the overall message. The review presents a strong defense of capitalism relative to alternative economic models potentially proposed by the "left". Very few, including Piketty, would disagree with the merits of capitalism. The fact that all advanced and prosperous economies have reached their current level of income by relying on markets, the fact that the fastest growing emerging markets are those that move closer to that model and by doing so are able to lift a large percentage of their population from below poverty levels, all speak up in favor of the power of markets and incentives to unleash growth.
But the debate cannot end up there. The success of capitalism as an economic model does not imply that we should accept current outcomes and that we should not discuss alternative models that, in comparison to other economic paradigms, might all look very similar but they could produce very different distributions of income. What Piketty and others have done is to raise awareness that since the early 80s, the economic model that we call capitalism has generated an outcome that is different from the one we had seen in the previous decades and that this outcome, in some countries, resemble what we saw before the Great Depression.
While we can debate the exact magnitude of these changes, it is clear that the strong correlation between productivity and wages has weakened over these decades. It is also clear that income growth has been going to a small part of the population, those with the highest earnings. And for a large majority of the population, income stopped growing (or started growing at a much slower rate). [On a technical matter: yes, we can discuss whether national income or GDP are capturing all the increases in welfare of the average citizen, but that discussion can go in both directions and to be fair we should also apply it to the earlier decades (if we believe that GDP growth underestimates welfare growth)].
Here is how I try to challenge the thinking of my students when I discuss income inequality. We all agree that the current economic model has allowed the income of many Americans to increase at a rate close to 2% for more than a century based on continuous productive accumulation of capital and innovation, an amazing success. But how would we think about the same economic model if this rate of growth slowed down and was very close to 0%? This would represent a big change in the economic outcome and would, for sure, raise concerns about why the model is failing to deliver relative to our expectations (that is the argument we use to call alternative models, like those of planned economies, a failure).
While it is true that GDP per capita growth has remained in line with historical experience over the last decades, the income of a large % of US households has either stopped growing or is growing at a rate much closer to 0% than to 2%. So if 0% growth for 100% of the population would represent a failure, what about 0% growth for 90% of the population? Regardless of how well capitalism has performed in the past, we need to open for a debate on the merits and outcomes of such a model that takes into account how the income and wealth that it generates gets distributed. There is no just one form of capitalism, there are many. Current tax rates, regulations are not set in stone and they are very different from what they were during many periods of the recent economic history so a debate on how inequality trends reflect on the successes and potential weaknesses of the current model is not only a healthy one but one that is needed.
One more comment regarding McCloskey's review. While I said I did not want to go into the details of the review, there was one that I found very surprising. The review argues that while income inequality might have increased, consumption inequality is a lot lower. One of the reasons is that the actual consumption of those who own six houses is not that different from those who own one as you can only live in one house at a time. That's an odd argument. If taken seriously it provides support from those on the "left" who argue for very high levels of taxation for the rich. Let's tax 100% of the value of those 5 extra houses given that they are not providing any consumption or welfare to those who own them.
Antonio Fatás
Thursday, November 20, 2014
Macroprudential policy and distribution of risk
There is very little doubt that housing prices and leverage played a strong role in the global financial crisis that started in 2008. As the effects of the crisis disappear many countries still struggle with the fear that the dynamics of household debt and leverage resemble those of the pre-crisis period (e.g. Sweden).
While I am sympathetic to the idea that increased leverage and debt increases risk, I am less convinced by the theoretical justifications that are commonly used. Typically, there is an assumption that leverage and debt are associated to the notion of "living beyond our means", which makes this behavior and unsustainable. This is not correct and there are plenty of subtleties that should not be ignored that are related to distributional issues.
Let's keep things simple. Imagine a world where the stock of housing is not going to change (we have enough houses for everyone). And imagine no population growth either (we do not need more houses). In this world, someone needs to own the assets, either those who live there or those who rent them to others. Imagine there is some utility that we all derive from owning our place. So if you ask me to choose between owning and renting assuming the financial cost of both is the same, I would rather own a place.
Initially, there are some people who rent their house because they do not have access to enough credit to buy a property. This requires that someone out there owns property and is happy renting it to others. Let's now change the access to credit of some of the constrained households. Either because changes in financial regulation, interest rates or simply because of economic growth, more households have access to mortgage financing. We expect to see an increase in the purchases of houses by tenants, an increase in the price of housing and an increase in the amount of leverage. Realize that the households that are buying houses are not living beyond their means. They are simply buying a good (the ownership of the house) that they did not have access to before. Their wealth (i.e. "equity") has not gone down, only their leverage has increased. So they are not living beyond their means, they simply hold more wealth in assets that is backed by the debt they now have access to. [There will be as well other general equilibrium effects that I am ignoring it].
How much macroeconomic risk does it represent the increase in debt and leverage? It all depends on how close these new households are to being financially constrained. If now there is a shock that reduces their income and housing prices, they might find themselves financially constrained and possibly bankrupt. This risk could be related to the increase in the level of debt prior to the shock but it does not need to be. What really matters is not the aggregate level of debt but the % of households that are now in a riskier position because they hold an illiquid asset whose price might change. To assess this risk we need to know something about the distribution of income, wealth and risk. In the aggregate, if there is a shock, the change in wealth associated to a decrease in housing prices is always the same. But what matters is who owns those assets. Is it those who have access to funding or those who are at the edge of being financially constrained? It might not be unreasonable to assume that as debt and leverage increase, it is mostly due to increases happening at the margin (those with lower financial resources) but it does not always need to be the case.
There are plenty of other examples one could make to reach a similar conclusion (housing prices grow because of changes in population, move to cities, increases in ownership of a second house, reduction in the size of household,...).
In summary, this is what I learn from this and other similar examples;
1. Debt should not always be equated to living beyond our means. It could be if the borrowing goes straight to consumption spending but when it goes to purchases of assets, in particular housing, the real issue is one of leverage and potential risk.
2. Leverage through acquisitions of assets can add risk to a household as long as we believe that the prices behind those assets are risky (and more so if we already know they overvalued). Understanding the fundamental driving forces behind the changes in asset prices is a must.
3. While leverage can increase macroeconomic risk, it can also be a sign of economic development. As countries develop leverage tends to increase because of increased sophistication and size of financial markets (this is what economists called financial deepening). This is normally seen as a positive development.
4. The macroeconomic risk of increased debt and leverage depends on the distribution of income, wealth and asset purchases. While the overall risk could be related to the aggregate amount of debt and leverage, the relationship is a lot more complex than that. Macro prudential policies need to be sophisticated and incorporate distributional issues in their assessments. One more reason why understanding the distribution of income and wealth is important.
Antonio Fatás
Sunday, November 16, 2014
German economic policy and chameleons
Wolfgang Munchau's FT article today is one of the most complete explanations I have seen about the origin and contradictions of the German economic orthodox dogma. The only issue that he does not address is how these economic views have survived over time despite the increasing evidence that their advice does not deliver the expected results.
Here is my guess from what I have learned from many heated discussions over the last years about economic policy in Europe: the resilience (stubbornness) of this view on economic policy comes from a combination of faith and the inability of the economic profession to apply enough real world filters to models.
Faith in a certain economic model comes from many years of being trained about the beauty of markets and all the inefficiencies that governments generate. But faith also comes from the belief that only through (individual) hard work and sacrifice (saving) one can achieve any economic progress. In this world (what Wolfgang Munchau refers to as Germany's parallel universe) there is no room for an economic crisis caused by lack of demand. Recessions only take place as a result of misbehavior, debt and lack of willingness to work hard (and reform). The only way to get out is to behave.
But faith alone might not be enough, policy makers and their advisors are required to look at the data and check how their priors allow them to understand economic outcomes. Here is where the economics profession and its ability to hide under economic models that have little empirical relevance provide the necessary support. A recent paper by Paul Pfleiderer about the misuse of theoretical models in finance and economics explains this logic very well. Many economic models are used in ways that make them "chameleons", they do not go through any real world filter and they fight back their criticisms with the argument that "the empirical-test jury is still out". In other words, we start with unrealistic assumptions, we generate a result that fits what we are looking for, we do not find evidence to support it but we can always claim that the evidence cannot conclusively reject the model either and we continue using the model for our economic policy advice.
So it is faith and the use of "chameleon" models that keeps the stubbornness of the German economic policy advice alive in Europe. And while this is going on, the Euro fatigue and discontent in many European countries keeps growing and polarizing the political landscape. The next round of elections will be an interesting test for the Euro/EU project.
Antonio Fatás
Sunday, November 9, 2014
The false rhetoric of (Euro) victims and offenders
Hans-Werner Sinn has written a new book with an analysis of the causes and potential solutions of the Euro crisis: "The Euro Trap: on Bursting Bubbles, Budgets and Beliefs". I have not read the book yet but I just went through a video of the presentation he made about a month ago at the Peterson Institute for International Economics. The video of the presentation as well as a transcript are available at the PIIE web site.
For those who have followed the writings of Hans-Werner Sinn there should be no surprise in the presentation. His views are very consistent and they put most of the emphasis on the price imbalances that were built prior to the crisis (the periphery becoming uncompetitive, interest rates being too low). These imbalances partly supported unsustainable growth that hid the need for structural reforms that were badly needed. His analysis of the crisis years is very similar: bailouts from the ECB and others, not enough austerity have also supported governments in their actions to avoid reform.
After Sinn's presentation, Fred Bergsten provides some insightful comments. He gives credit to the book as it highlights some of the weaknesses among Euro countries (it is hard to disagree with the view that reforms move very slow in Europe and that government will find any excuse to slow them even further). But Bergsten also provides very critical comments about Sinn's view of the crisis and its solutions. I like in particular Bergsten's emphasis on the economic benefits that Germany has derived of the creation of the Euro area. He goes as far as saying that Germany is possibly the only country that has so far benefitted from the Euro (going against the German conventional wisdom of who are the winners and the losers of EMU).
One of the issues that Bergsten does not bring up enough is the misplaced (in my view) emphasis that Sinn puts on relative prices and competitiveness. The idea that in periphery countries the cost of production became too high and unsustainable and that it now requires deflation in the periphery (and some inflation in Germany) is a constant argument in Sinn's presentations. But the data does not fully support his views. It is not that relative prices do not matter, but they do not matter as much as he claims and I would go as far as saying that they are not a central part of the pre-crisis or post-crisis experience of Euro members.
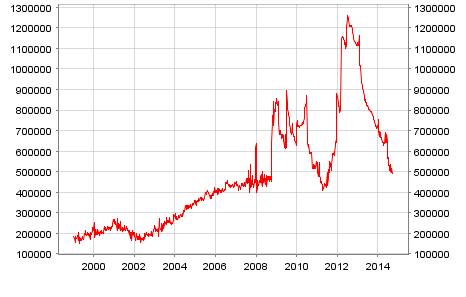
Here is a quick chart to support my views. This is the value of goods exports (data originally in in billions of US dollars, from the OECD) for Germany, France and Spain since the Euro was launched. Data is rebased so that it equals 100 in 1999Q1.

It is hard to see in this chart the story of the periphery (Spain) high prices reducing growth via lack of competitiveness (before or after the crisis). Even compared to Germany where we know that there was a significant internal devaluation via very low nominal wage growth, exports in Spain grew at a similar speed before the crisis and faster than in Germany. Yes, the current account in Spain was on an unsustainable trajectory but it was caused by capital flows supporting excessive imports.
Then, why the insistence on prices? Because it fits well the rhetoric of misbehavior that led to the crisis. Under this view, countries belong to one of two groups: the victims and the offenders. And it explains everything: the differences between the savers and the borrowers, the ones who reform and the ones who never do, the ones who control debt and the ones that just let it increase, the ones where workers are reasonable and they accept lower living standards and the ones where they are not and want to live beyond its means. Reality is more complex than that, countries do not always belong to the same side of these imbalances, some imbalances are not central to explain the crisis and all imbalances have two sides to them.
Antonio Fatás
For those who have followed the writings of Hans-Werner Sinn there should be no surprise in the presentation. His views are very consistent and they put most of the emphasis on the price imbalances that were built prior to the crisis (the periphery becoming uncompetitive, interest rates being too low). These imbalances partly supported unsustainable growth that hid the need for structural reforms that were badly needed. His analysis of the crisis years is very similar: bailouts from the ECB and others, not enough austerity have also supported governments in their actions to avoid reform.
After Sinn's presentation, Fred Bergsten provides some insightful comments. He gives credit to the book as it highlights some of the weaknesses among Euro countries (it is hard to disagree with the view that reforms move very slow in Europe and that government will find any excuse to slow them even further). But Bergsten also provides very critical comments about Sinn's view of the crisis and its solutions. I like in particular Bergsten's emphasis on the economic benefits that Germany has derived of the creation of the Euro area. He goes as far as saying that Germany is possibly the only country that has so far benefitted from the Euro (going against the German conventional wisdom of who are the winners and the losers of EMU).
One of the issues that Bergsten does not bring up enough is the misplaced (in my view) emphasis that Sinn puts on relative prices and competitiveness. The idea that in periphery countries the cost of production became too high and unsustainable and that it now requires deflation in the periphery (and some inflation in Germany) is a constant argument in Sinn's presentations. But the data does not fully support his views. It is not that relative prices do not matter, but they do not matter as much as he claims and I would go as far as saying that they are not a central part of the pre-crisis or post-crisis experience of Euro members.
Here is a quick chart to support my views. This is the value of goods exports (data originally in in billions of US dollars, from the OECD) for Germany, France and Spain since the Euro was launched. Data is rebased so that it equals 100 in 1999Q1.
It is hard to see in this chart the story of the periphery (Spain) high prices reducing growth via lack of competitiveness (before or after the crisis). Even compared to Germany where we know that there was a significant internal devaluation via very low nominal wage growth, exports in Spain grew at a similar speed before the crisis and faster than in Germany. Yes, the current account in Spain was on an unsustainable trajectory but it was caused by capital flows supporting excessive imports.
Then, why the insistence on prices? Because it fits well the rhetoric of misbehavior that led to the crisis. Under this view, countries belong to one of two groups: the victims and the offenders. And it explains everything: the differences between the savers and the borrowers, the ones who reform and the ones who never do, the ones who control debt and the ones that just let it increase, the ones where workers are reasonable and they accept lower living standards and the ones where they are not and want to live beyond its means. Reality is more complex than that, countries do not always belong to the same side of these imbalances, some imbalances are not central to explain the crisis and all imbalances have two sides to them.
Antonio Fatás
Wednesday, October 29, 2014
Riksbank and ECB: reverse asymmetry
The Swedish central bank just lowered interest rates to zero because of deflation risks. This action comes after ignoring repeated warnings from Lars Svensson who had joined the bank in 2007 and later resigned because of disagreements with monetary policy decisions. What it is interesting is the parallel between Riksbank decisions and ECB decisions. In both cases, these central banks went through a period of optimism that make them raise interest rates to deal with inflationary pressures. In the case of Sweden interest rates were raised from almost zero to 2% in 2012. In the case of the ECB interest rates were raised from 1% to 1.5% during 2011. Also, in both cases, after a significant expansion in their balance sheets following the 2008 crisis, there was a sharp reduction in the years that followed. During 2010 the balance sheet of the Riksbank was reduced by more than 50%. In the case of the ECB it was later in 2013 when the balance sheet shrank by about 1 Trillion Euros. Their policies stand in contrast with those of the US Federal Reserve and the Bank of England where interest rates still have to start going up after the initial actions taken during the crisis and where the expansion in their balance sheet has not started to being reversed.
The consequences of the policies of the ECB and Riksbank are clear: a continuous fall in their inflation rates that has raised the risk of either a deflationary period or a period of too-low inflation. What is more surprising about their policy actions is their low speed of reaction as the data was clearly signaling that their monetary policy stance was too tight for months or years. In both cases their decisions to bring down their interest rate or take further action has happened in very small steps. And every time a step is announced the reaction has always been asking what will be next. So the announcement of the Riksbank has now been met with questions about when they will have to start their own version of QE. Same as for the ECB where their latest announcements has led to expectations of future more aggressive actions.
What we learned from these two examples is that central banks are much less accountable than what we thought about inflation targets. And they make use of the lack of clarity on the exact definition of their targets to produce a policy that is clearly asymmetric in nature. Taking some time to go from 0% inflation to 2% inflation is ok but if inflation was 4% I am sure that their actions will be much more desperate. In the case of the ECB their argument is that the inflation target is defined as an asymmetric target ("close to but below 2%"). But this asymmetry, which was never an issue before the current crisis, has very clear consequences on the ability of central banks to react to deep crisis with deflationary risks.
What we have learned during the current crisis is that an asymmetric 2% inflation target is too low. Raising the target might be the right thing to do but in the absence of a higher target, at a minimum we should reverse the asymmetry implied by the ECB mandate. Inflation should be close to but above 2% and this should lead to very strong reaction when inflation is persistently below the 2% target.
Antonio Fatás
Wednesday, October 1, 2014
The permanent scars of fiscal consolidation
The effect that fiscal consolidation has on GDP growth has probably generated more controversy than any other economic debate since the start of the 2008 crisis. How large are fiscal multipliers? Can fiscal contractions be expansionary?
Last year, Olivier Blanchard and Daniel Leigh at the IMF produced a paper that claimed that the IMF and other international organizations had underestimated the size of fiscal policy multipliers. The paper argued that the assumed multiplier of about 0.5 was too low and that the right number was about 1.5 (the way you think about this number is the $ impact on GDP of a $1 fiscal policy contraction).
While that number is already large, it is possible that the true costs of fiscal consolidations are much larger. In a recent research project (draft coming soon) I have been looking at the effects that fiscal consolidations have on potential GDP. Why is this an interesting topic? Because it happens to be that during the last 5 years we have been seriously revising the level (and in some cases the growth rate) of potential GDP in these economies. And while there might be good reasons to do so, the extent to which we have done this is dramatic and one gets the sense by analyzing the data that what is really happening is that the cyclical contraction is just leading to a permanent revision of long-term GDP forecasts (I wrote about this in my latest post).
To prove my point I decided to replicate the analysis of Blanchard and Leigh but instead of using the forecast error on output growth, I used the forecast error on potential output changes. Here are the details, which follow Blanchard and Leigh as close as I can: I take the April 2010 issue of the IMF World Economic Outlook and calculate:
- The predicted fiscal consolidation over the next two years (2010-11)
- The expected change in potential output over the next two years (2010-11).
I then look at the actual change in potential output during those years (2010-11) as presented in the April 2014 IMF World Economic Outlook. Comparing this figure to the forecast done back in April 2010, we can calculate for each country the forecast error associated to potential output growth.
Most models assume that there should be no correlation between these two numbers. Fiscal consolidations affect output in the short run but not in the long run. But under some assumptions (hysteresis or growth effects of business cycles) cyclical conditions can have a permanent effect on potential output (I have written about it here). So what is the evidence?

If we include all European countries that are part of the Advanced Economics group as defined by the IMF we get the relationship depicted in the graph above. There is a strong correlation between the two variables: fiscal consolidations have led to a large change in our views on potential output. The coefficient (strongly significant from a statistical point of view) is around -0.75.
Just for comparison, and going back to the original work of Blanchard and Leigh, the coefficient using output growth (not potential) is around -1.1. Because the forecast for output growth already included a multiplier of about 0.5, Blanchard and Leigh's interpretation was that the IMF had been underestimating multipliers and instead of 0.5 the true number was 1.6. In my regression, the theoretical multiplier built into the IMF model must be zero, which means that the true long-term multiplier is just the coefficient on the regression, about 0.7. But this number is very large and it provides supporting evidence of the arguments made by DeLong and Summers regarding the possibility of fiscal contractions leading to increases in debt via the permanent effects they have on potential output.
There are many interesting questions triggered by the correlation above: What are the mechanisms through which potential output is affected? Is potential output really changing or is just our perception about long-term growth that is changing? These are all interesting questions that I hope to address as I translate the analysis into a proper draft for a paper. To be continued.
Antonio Fatás
Last year, Olivier Blanchard and Daniel Leigh at the IMF produced a paper that claimed that the IMF and other international organizations had underestimated the size of fiscal policy multipliers. The paper argued that the assumed multiplier of about 0.5 was too low and that the right number was about 1.5 (the way you think about this number is the $ impact on GDP of a $1 fiscal policy contraction).
While that number is already large, it is possible that the true costs of fiscal consolidations are much larger. In a recent research project (draft coming soon) I have been looking at the effects that fiscal consolidations have on potential GDP. Why is this an interesting topic? Because it happens to be that during the last 5 years we have been seriously revising the level (and in some cases the growth rate) of potential GDP in these economies. And while there might be good reasons to do so, the extent to which we have done this is dramatic and one gets the sense by analyzing the data that what is really happening is that the cyclical contraction is just leading to a permanent revision of long-term GDP forecasts (I wrote about this in my latest post).
To prove my point I decided to replicate the analysis of Blanchard and Leigh but instead of using the forecast error on output growth, I used the forecast error on potential output changes. Here are the details, which follow Blanchard and Leigh as close as I can: I take the April 2010 issue of the IMF World Economic Outlook and calculate:
- The predicted fiscal consolidation over the next two years (2010-11)
- The expected change in potential output over the next two years (2010-11).
I then look at the actual change in potential output during those years (2010-11) as presented in the April 2014 IMF World Economic Outlook. Comparing this figure to the forecast done back in April 2010, we can calculate for each country the forecast error associated to potential output growth.
Most models assume that there should be no correlation between these two numbers. Fiscal consolidations affect output in the short run but not in the long run. But under some assumptions (hysteresis or growth effects of business cycles) cyclical conditions can have a permanent effect on potential output (I have written about it here). So what is the evidence?
If we include all European countries that are part of the Advanced Economics group as defined by the IMF we get the relationship depicted in the graph above. There is a strong correlation between the two variables: fiscal consolidations have led to a large change in our views on potential output. The coefficient (strongly significant from a statistical point of view) is around -0.75.
Just for comparison, and going back to the original work of Blanchard and Leigh, the coefficient using output growth (not potential) is around -1.1. Because the forecast for output growth already included a multiplier of about 0.5, Blanchard and Leigh's interpretation was that the IMF had been underestimating multipliers and instead of 0.5 the true number was 1.6. In my regression, the theoretical multiplier built into the IMF model must be zero, which means that the true long-term multiplier is just the coefficient on the regression, about 0.7. But this number is very large and it provides supporting evidence of the arguments made by DeLong and Summers regarding the possibility of fiscal contractions leading to increases in debt via the permanent effects they have on potential output.
There are many interesting questions triggered by the correlation above: What are the mechanisms through which potential output is affected? Is potential output really changing or is just our perception about long-term growth that is changing? These are all interesting questions that I hope to address as I translate the analysis into a proper draft for a paper. To be continued.
Antonio Fatás
Wednesday, September 17, 2014
Italian workers were too productive for 20 years
The 2008 crisis has resulted in significant downward revisions of potential growth for most advanced economies. As output collapsed we revised down our expectations of what is feasible in the long-term. This has resulted in estimates of potential output that are much lower than the ones we had before the crisis. There are several interpretations of these revisions, some of which can be very depressing.
One interpretation is that we just realized that demographics and technology would not be as favorable as we thought going forward. The crisis might have raised awareness that demographic trends (aging) combined with weaker productivity growth will be unable to deliver the same growth rates as before. This is bad news but if this is what is going on, then we need to accept it or find ways to reverse those trends (increasing retirement age, finding levers for faster innovation,...).
But this cannot be the main story behind the revisions of potential output given that most of the revisions are about the level of GDP, not so much about the growth rate going forward. As an illustration, I am plotting below the output gap for Italy as estimated by the IMF World Economic Outlook back in April 2009 and in its latest issue (April 2014). The output gap is the difference between actual GDP and potential GDP.

Since the crisis started not only we have changed our views about the future but we have also changed our views of the past. If you look at the blue line you can see that in 2009 we thought that the Italian economy had been growing at a rate similar to potential output for the previous 19 years (and remember that growth rates in Italy were already low during most of these years). But today we believe that Italy was producing "too much" during all those 19 years (with the exception of 1993). Every single year Italy was somehow employing too many workers or those workers where being too productive. Why that change? Because of the interpretation that some (most?) of the GDP fall during the crisis will be permanent and to make this consistent with what happened before the crisis we need to lower out estimates of potential output in those years as well. Let me me be clear, we have no theory and no direct evidence that potential output during those years was lower than what we thought before, we are simply finding a way to validate the current level of output that seems to be going nowhere. And because it GDP refuses to grow it must be permanent and structural.
The alternative (and much more depressing) interpretation is that a crisis, which is clearly global in its nature, this is not an Italian crisis, has resulted in a a very long period of low growth. This low growth has had an effect on potential output because long-term growth rates cannot be completely separated from cyclical conditions. Labor market conditions have an effect on long-term unemployment, discouraged workers and participation rates (what Blanchard and Summers called backed in 1986 hysteresis in labor markets). But even more fundamentally, investment rates, technology adoption are slowed down by cyclical conditions and these are the forces that drive potential growth rates. So the longer is the recession, the bigger the impact on potential output (I was very interested in these dynamics back in the late 90s and wrote a couple of papers with supporting empirical evidence: here and here).
From a policy point of view the two interpretation lead to completely different recommendations. Under the first interpretation we have been living in a fictitious world for the last 20 years thinking that we were more productive. Finally we understand that we are not so it is the time to adjust and live within our means. As this working paper from Bundesbank puts it
Consequently, earlier growth paths are probably no longer achievable, particularly for some European countries. Substantial macroeconomic imbalances built up... and painful adjustment processes are now underway. Attempts to explain this merely through a major shortfall in aggregate demand are far from convincing.
Under the alternative scenario we are now learning that the costs of crises are a lot larger than what we thought. We are not just talking about transitory output losses but events that leave permanent scars on the level of GDP. So it is time to react and generate enough growth not just to go back to potential but to restore the mechanisms that drive its long-term growth.
Antonio Fatás
One interpretation is that we just realized that demographics and technology would not be as favorable as we thought going forward. The crisis might have raised awareness that demographic trends (aging) combined with weaker productivity growth will be unable to deliver the same growth rates as before. This is bad news but if this is what is going on, then we need to accept it or find ways to reverse those trends (increasing retirement age, finding levers for faster innovation,...).
But this cannot be the main story behind the revisions of potential output given that most of the revisions are about the level of GDP, not so much about the growth rate going forward. As an illustration, I am plotting below the output gap for Italy as estimated by the IMF World Economic Outlook back in April 2009 and in its latest issue (April 2014). The output gap is the difference between actual GDP and potential GDP.
Since the crisis started not only we have changed our views about the future but we have also changed our views of the past. If you look at the blue line you can see that in 2009 we thought that the Italian economy had been growing at a rate similar to potential output for the previous 19 years (and remember that growth rates in Italy were already low during most of these years). But today we believe that Italy was producing "too much" during all those 19 years (with the exception of 1993). Every single year Italy was somehow employing too many workers or those workers where being too productive. Why that change? Because of the interpretation that some (most?) of the GDP fall during the crisis will be permanent and to make this consistent with what happened before the crisis we need to lower out estimates of potential output in those years as well. Let me me be clear, we have no theory and no direct evidence that potential output during those years was lower than what we thought before, we are simply finding a way to validate the current level of output that seems to be going nowhere. And because it GDP refuses to grow it must be permanent and structural.
The alternative (and much more depressing) interpretation is that a crisis, which is clearly global in its nature, this is not an Italian crisis, has resulted in a a very long period of low growth. This low growth has had an effect on potential output because long-term growth rates cannot be completely separated from cyclical conditions. Labor market conditions have an effect on long-term unemployment, discouraged workers and participation rates (what Blanchard and Summers called backed in 1986 hysteresis in labor markets). But even more fundamentally, investment rates, technology adoption are slowed down by cyclical conditions and these are the forces that drive potential growth rates. So the longer is the recession, the bigger the impact on potential output (I was very interested in these dynamics back in the late 90s and wrote a couple of papers with supporting empirical evidence: here and here).
From a policy point of view the two interpretation lead to completely different recommendations. Under the first interpretation we have been living in a fictitious world for the last 20 years thinking that we were more productive. Finally we understand that we are not so it is the time to adjust and live within our means. As this working paper from Bundesbank puts it
Consequently, earlier growth paths are probably no longer achievable, particularly for some European countries. Substantial macroeconomic imbalances built up... and painful adjustment processes are now underway. Attempts to explain this merely through a major shortfall in aggregate demand are far from convincing.
Under the alternative scenario we are now learning that the costs of crises are a lot larger than what we thought. We are not just talking about transitory output losses but events that leave permanent scars on the level of GDP. So it is time to react and generate enough growth not just to go back to potential but to restore the mechanisms that drive its long-term growth.
Antonio Fatás
Sunday, September 14, 2014
ECB: QE or QT (Quantitative Tightening)?
Charles Wyplosz at VoxEU questions the potential effectiveness of quantitative easing (QE) as recently announced by the ECB. His main concern is that the ECB version of QE is supply driven, as opposed to the one implemented by the other central banks which is demand driven.
In the case of the US Federal Reserve or the Bank of England, the central bank buys securities and those securities permanently increase the size of the bank's balance sheet. Liquidity is provided regardless of the actions of commercial banks. In contrast, the ECB so far had always relied on the demand from commercial banks for liquidity. The ECB made loans available to commercial banks, and as long as commercial banks demanded those loans, the balance sheet of the central bank also increased (with the deposits of commercial banks being the liability that appears on the other side). But this means that in many ways commercial banks are driving QE. It is their desire to hold more liquidity the one that determines the expansion (or contraction) in the size of the ECB balance sheet.
To understand these dynamics, here are some charts from the ECB web site. First the total size of the balance sheet of the ECB.

We can see several steps after 2008 that increased the size of the ECB balance sheet to about 3 trillion Euros. But we can also see that since 2013, the balance sheet has decreased by more than 1 trillion euros (and no one noticed, by the way). What was he ECB doing? Not much. This is simply the outcome of commercial banks returning the loans that they have gotten earlier from the ECB. Here is the chart with those loans ("lending related to monetary policy operations").
And remember that these loans had to be sitting somewhere else on the liability side of the ECB, they appear as deposits of commercial banks (reserves). Here are the balances of the two accounts where these funds are held (current account and deposit facility).


The pattern of the four charts is very clear: the availability of liquidity by the ECB led to a very large amount of loans being demanded by commercial banks. This increased the size of the balance sheet and the deposits of commercial banks on the ECB. This liquidity had limited effect on lending to the private sector (although it probably protected the financial sector from an even-larger crisis). But as economic conditions stabilized or improved, commercial banks saw no need to hold such large amounts of liquidity so they simply paid back the loans to the central bank. The fact that interest rates on these deposits are now negative led to an acceleration of this trend. So the actions of the central banks (such as negative interest rates on banks' deposits) are not creating an incentive for commercial banks to lend, they are simply creating an incentive for the liquidity that the ECB created to decrease substantially (reverse QE!).
In the last months the ECB has tried to be more aggressive, first with the launch of targeted long term refinancing operations (TLTRO) back in June. But the details of this plan are still unclear (does anyone remember it?) plus it relies once again on the willingness of commercial banks to lend to the private sector and finance this lending via the central bank. But we just saw commercial banks returning all the liquidity that they had previously borrowed from the ECB. Why will the ask for more?
In the last meeting, the ECB announced a change in strategy with the plan to purchase asset-backed securities. While in some sense this is the first time where the ECB will engage in supply-driven QE (no loans associated to these purchases), the wording of the plan has left many questions open about the extent to which this is a "permanent-enough" commitment to increase the ECB balance sheet and, in addition, the potential volume of these purchases could be small. Small enough that they will not be compensating the fall in the ECB balance sheet that we have witnessed in the last year.
Unfortunately, the ECB is likely to face soon the same question it has faced over the last years: what is next?
Antonio Fatás
In the case of the US Federal Reserve or the Bank of England, the central bank buys securities and those securities permanently increase the size of the bank's balance sheet. Liquidity is provided regardless of the actions of commercial banks. In contrast, the ECB so far had always relied on the demand from commercial banks for liquidity. The ECB made loans available to commercial banks, and as long as commercial banks demanded those loans, the balance sheet of the central bank also increased (with the deposits of commercial banks being the liability that appears on the other side). But this means that in many ways commercial banks are driving QE. It is their desire to hold more liquidity the one that determines the expansion (or contraction) in the size of the ECB balance sheet.
To understand these dynamics, here are some charts from the ECB web site. First the total size of the balance sheet of the ECB.
We can see several steps after 2008 that increased the size of the ECB balance sheet to about 3 trillion Euros. But we can also see that since 2013, the balance sheet has decreased by more than 1 trillion euros (and no one noticed, by the way). What was he ECB doing? Not much. This is simply the outcome of commercial banks returning the loans that they have gotten earlier from the ECB. Here is the chart with those loans ("lending related to monetary policy operations").
And remember that these loans had to be sitting somewhere else on the liability side of the ECB, they appear as deposits of commercial banks (reserves). Here are the balances of the two accounts where these funds are held (current account and deposit facility).
The pattern of the four charts is very clear: the availability of liquidity by the ECB led to a very large amount of loans being demanded by commercial banks. This increased the size of the balance sheet and the deposits of commercial banks on the ECB. This liquidity had limited effect on lending to the private sector (although it probably protected the financial sector from an even-larger crisis). But as economic conditions stabilized or improved, commercial banks saw no need to hold such large amounts of liquidity so they simply paid back the loans to the central bank. The fact that interest rates on these deposits are now negative led to an acceleration of this trend. So the actions of the central banks (such as negative interest rates on banks' deposits) are not creating an incentive for commercial banks to lend, they are simply creating an incentive for the liquidity that the ECB created to decrease substantially (reverse QE!).
In the last months the ECB has tried to be more aggressive, first with the launch of targeted long term refinancing operations (TLTRO) back in June. But the details of this plan are still unclear (does anyone remember it?) plus it relies once again on the willingness of commercial banks to lend to the private sector and finance this lending via the central bank. But we just saw commercial banks returning all the liquidity that they had previously borrowed from the ECB. Why will the ask for more?
In the last meeting, the ECB announced a change in strategy with the plan to purchase asset-backed securities. While in some sense this is the first time where the ECB will engage in supply-driven QE (no loans associated to these purchases), the wording of the plan has left many questions open about the extent to which this is a "permanent-enough" commitment to increase the ECB balance sheet and, in addition, the potential volume of these purchases could be small. Small enough that they will not be compensating the fall in the ECB balance sheet that we have witnessed in the last year.
Unfortunately, the ECB is likely to face soon the same question it has faced over the last years: what is next?
Antonio Fatás
Wednesday, September 10, 2014
The Euro crash?
As the US federal reserve might start soon raising interest rates and the ECB is about to being his quantitative easing plans, some see this divergence as a potential source of a large fall in the value of the Euro that might have already started over the last days.
Given that we have witnessed in the past similar episodes of divergence in monetary policy (or at least monetary policy moving at very different speeds), it is interesting to check what happened during those episodes.
Below is the evolution of the USD/EUR exchange rate since 1975 (click on the picture for a larger version). Of course, the Euro did not exist before 1999 but what I have done is to replace the Euro with the German Mark (converted at the Mark/Euro rate that was fixed at the time the Euro was launched). So the chart is really a combination of the German/US exchange rate before 1999 and the Euro/US exchange rate post-1999. I will refer to the Euro even in the earlier years for simplicity.
 The line drifts up mostly because inflation in Europe has consistently been below that of the US (we expect the currency with the higher inflation to depreciate over time). The effect is more pronounced in the early decades because that's when inflation differentials were the largest (between Germany and the US).
In addition to the trend we see two episodes where the dollar strengthened substantially relative to the Euro and then reversed in the opposite direction at a similar speed to go back towards its trend. The first episode was in the early 80s where a combination of tight monetary policy and large budget deficits in the US put upward pressure on interest rates and started a persistent swing upwards of the US dollar. The US dollar reached a value that was clearly above any reasonable estimate of fundamentals and led to the Plaza Accord in September 1985 where finance ministers from Europe, Japan and the US agreed to intervene to keep the dollar from continuing its appreciation. The reversal that followed was also very dramatic.
The second episode takes place in the mid to late 90s and coincides with very strong growth rates in the US that also attracted the interest of investors. Monetary policy itself was not that different but growth rates were. In addition the launch of the Euro in 1999 was viewed by some as a source of uncertainty and potential bad news for the Euro economy and its currency. This time, the appreciation of the US dollar was also stopped by a coordinated intervention of the US federal reserve and the ECB in November 2000.
In these two episodes we do see a pattern of divergence in economic conditions between Europe and the US that triggers an appreciation of the US currency although not always related to monetary policy (and in both cases the appreciation led to overvaluation and large volatility). Are we supposed to expect the same thing now? It is certainly a possibility but far from from guaranteed. Why? Because if we look carefully at some of the other years we will see that there are several other episodes during which US growth was also stronger than European growth and US interest rates were raising faster and the US dollar did not appreciate, in fact it depreciated significantly.
For example, in the period 2002-2003 Europe was in the middle of a recession with growth rates that were significantly lower than those of the US. Interest rates in Europe were coming down and remained at 2% until the fall of 2005. At the same time, US interest rates were climbing from a low 1% to 5.25% by the summer of 2006. In those years, the dollar not only did not appreciate but instead it depreciated relative to the Euro. In January 2002 the exchange rate was below 0.9 USD/EUR and by 2005 the Euro had climbed to 1.30 USD/EUR.
It is also interesting to notice that since the 2008 crisis started, the USD/EUR exchange rate has remained quite "stable" (compared to most other previous years). It has fluctuated between 1.25-1.40 despite the dramatic changes that we have seen on both sides of the Atlantic. The sovereign debt crisis in Europe was forecasted to have a large effect on the value of the Euro but the currency remained stable all through the crisis.
If economic conditions continue to diverge between the US and Europe and the Euro depreciates heavily relative to the US Dollar, no one will be surprised. It will clearly look like a great textbook illustration about how interest rates and capital flows move currencies. But history tells us that there is no guarantee that this will happen, exchange rates are a lot more volatile and unpredictable than what some theories make you believe. Regardless of the final change in the exchange rate, what is very likely is that we will witness a lot more volatility in exchange rates over the coming months and years, in contrast with the stability that we have enjoyed for the last years.
Antonio Fatás
Given that we have witnessed in the past similar episodes of divergence in monetary policy (or at least monetary policy moving at very different speeds), it is interesting to check what happened during those episodes.
Below is the evolution of the USD/EUR exchange rate since 1975 (click on the picture for a larger version). Of course, the Euro did not exist before 1999 but what I have done is to replace the Euro with the German Mark (converted at the Mark/Euro rate that was fixed at the time the Euro was launched). So the chart is really a combination of the German/US exchange rate before 1999 and the Euro/US exchange rate post-1999. I will refer to the Euro even in the earlier years for simplicity.
In addition to the trend we see two episodes where the dollar strengthened substantially relative to the Euro and then reversed in the opposite direction at a similar speed to go back towards its trend. The first episode was in the early 80s where a combination of tight monetary policy and large budget deficits in the US put upward pressure on interest rates and started a persistent swing upwards of the US dollar. The US dollar reached a value that was clearly above any reasonable estimate of fundamentals and led to the Plaza Accord in September 1985 where finance ministers from Europe, Japan and the US agreed to intervene to keep the dollar from continuing its appreciation. The reversal that followed was also very dramatic.
The second episode takes place in the mid to late 90s and coincides with very strong growth rates in the US that also attracted the interest of investors. Monetary policy itself was not that different but growth rates were. In addition the launch of the Euro in 1999 was viewed by some as a source of uncertainty and potential bad news for the Euro economy and its currency. This time, the appreciation of the US dollar was also stopped by a coordinated intervention of the US federal reserve and the ECB in November 2000.
In these two episodes we do see a pattern of divergence in economic conditions between Europe and the US that triggers an appreciation of the US currency although not always related to monetary policy (and in both cases the appreciation led to overvaluation and large volatility). Are we supposed to expect the same thing now? It is certainly a possibility but far from from guaranteed. Why? Because if we look carefully at some of the other years we will see that there are several other episodes during which US growth was also stronger than European growth and US interest rates were raising faster and the US dollar did not appreciate, in fact it depreciated significantly.
For example, in the period 2002-2003 Europe was in the middle of a recession with growth rates that were significantly lower than those of the US. Interest rates in Europe were coming down and remained at 2% until the fall of 2005. At the same time, US interest rates were climbing from a low 1% to 5.25% by the summer of 2006. In those years, the dollar not only did not appreciate but instead it depreciated relative to the Euro. In January 2002 the exchange rate was below 0.9 USD/EUR and by 2005 the Euro had climbed to 1.30 USD/EUR.
It is also interesting to notice that since the 2008 crisis started, the USD/EUR exchange rate has remained quite "stable" (compared to most other previous years). It has fluctuated between 1.25-1.40 despite the dramatic changes that we have seen on both sides of the Atlantic. The sovereign debt crisis in Europe was forecasted to have a large effect on the value of the Euro but the currency remained stable all through the crisis.
If economic conditions continue to diverge between the US and Europe and the Euro depreciates heavily relative to the US Dollar, no one will be surprised. It will clearly look like a great textbook illustration about how interest rates and capital flows move currencies. But history tells us that there is no guarantee that this will happen, exchange rates are a lot more volatile and unpredictable than what some theories make you believe. Regardless of the final change in the exchange rate, what is very likely is that we will witness a lot more volatility in exchange rates over the coming months and years, in contrast with the stability that we have enjoyed for the last years.
Antonio Fatás
Sunday, September 7, 2014
Whatever it takes to see helicopter Mario (Draghi)
Mario Draghi surprised markets last week with a further cut in interest rates and a QE plan to start purchases of assets to expand the ECB balance sheet. These two actions were welcome as well as the change in the content and tone of his comments that are finally make it clear the need for strong policy actions in Europe.
Unfortunately, the fear is that this is coming too late and might not be enough. While the ECB plan to buy assets could expand its balance sheet over the coming months, the reality is that this move might just take its size to where it was several months ago. It is true that purchases of certain assets could have a stronger impact than the previous rounds of bank lending, but this might not be enough.
And when it comes to interest rates, while the ECB has finally reached zero, it took so long that in the last months the Euro area has seen a dangerous move towards very low inflation. And as inflation went down, real interest rates went up. Below is a chart that compares real interest rates in the Euro area and the US (real interest rates are calculated as the central bank interest rate minus the one-year inflation over the previous year).

First thing we noticed is that since the the summer of 2012 real interest rates have increased in Europe while they have remained broadly stable in the US. In the last two years, while real interest rates have increased by more than 1% in Europe, they have gone down by about 1% in the US. And this is all the result of the difference in behavior in inflation, which is possibly the result of the differences in policies we see during 2011 with much higher interest rates in the Euro area than in the US.
If the recent ECB actions are not enough, what else is to be done? Maybe European governments start listening to Mario Draghi and we see a reversal of fiscal policy, possibly in a coordinated fashion across Euro members. In the absence of this, the ECB has very few tools left at its disposal. It could try to increase inflation expectations, hoping that this would translate into increases in wages and prices. But raising inflation expectations would require very strong communications possibly making explicit that a temporary deviation of inflation above 2% would be welcome. Or even better, an explicit increase in the inflation target of the ECB (which could be temporary, for X years).
The only other alternative is "helicopter money", which implies a permanent increase in the monetary base/supply via either permanent purchases of assets or direct transfers to the governments or households (read Simon Wren-Lewis explain the difference between QE and helicopter money or Willem Buiter discuss why helicopter money always works). There has been some recent talk among central bankers about this idea but it has always been ruled out because of legal or practical constraints, which are likely to be more binding in the case of the ECB.
The discussion around helicopter money in the US led to the expression "helicopter Ben" to refer to the former chairman of the federal reserve, Ben Bernanke. Maybe it is time to see "helicopter Mario" do whatever it takes to save the Euro area. And finding a picture to illustrate what this would look like is so much easy with Mario Draghi...

Antonio Fatás
Unfortunately, the fear is that this is coming too late and might not be enough. While the ECB plan to buy assets could expand its balance sheet over the coming months, the reality is that this move might just take its size to where it was several months ago. It is true that purchases of certain assets could have a stronger impact than the previous rounds of bank lending, but this might not be enough.
And when it comes to interest rates, while the ECB has finally reached zero, it took so long that in the last months the Euro area has seen a dangerous move towards very low inflation. And as inflation went down, real interest rates went up. Below is a chart that compares real interest rates in the Euro area and the US (real interest rates are calculated as the central bank interest rate minus the one-year inflation over the previous year).
If the recent ECB actions are not enough, what else is to be done? Maybe European governments start listening to Mario Draghi and we see a reversal of fiscal policy, possibly in a coordinated fashion across Euro members. In the absence of this, the ECB has very few tools left at its disposal. It could try to increase inflation expectations, hoping that this would translate into increases in wages and prices. But raising inflation expectations would require very strong communications possibly making explicit that a temporary deviation of inflation above 2% would be welcome. Or even better, an explicit increase in the inflation target of the ECB (which could be temporary, for X years).
The only other alternative is "helicopter money", which implies a permanent increase in the monetary base/supply via either permanent purchases of assets or direct transfers to the governments or households (read Simon Wren-Lewis explain the difference between QE and helicopter money or Willem Buiter discuss why helicopter money always works). There has been some recent talk among central bankers about this idea but it has always been ruled out because of legal or practical constraints, which are likely to be more binding in the case of the ECB.
The discussion around helicopter money in the US led to the expression "helicopter Ben" to refer to the former chairman of the federal reserve, Ben Bernanke. Maybe it is time to see "helicopter Mario" do whatever it takes to save the Euro area. And finding a picture to illustrate what this would look like is so much easy with Mario Draghi...
Antonio Fatás
Tuesday, September 2, 2014
Wage moderation: a recipe for growth?
In the economic policy debate in the Euro area it is common to hear a reference to the need for structural reforms in order to improve competitiveness, under the assumption that this is the recipe that Germany has followed so successfully over the last years. To this logic it is common to add a recommendation for wage moderation. Low wage growth seems to be a necessity in Europe given the increased competition from emerging markets. While there can be some truth to this argument, let me show some evidence that questions some of the facts and then present some additional conceptual concerns with the way wage moderation and competitiveness are normally linked.
Below is a chart that summarizes data provided by the OECD on productivity, compensation and unit labor costs. I computed the accumulated change from 2000 to 2013 (except for the US where there was no data for 2013, so the period is 2000-2012).

The blue column (real GDP per hour) represents improvements in productivity. This is the ultimate source of sustainable improvements in living standards. What we see is a significant gap between the US and Europe (more so if we consider that the US is 'missing' one year). When we look inside Europe we see a big outlier: Italy, where GDP per hour has barely changed in the last 13 years. There are some interesting differences among the other countries with Spain seeing an 18% increase over the period compared to 15% in Germany and 12-13% in France and the UK. In this first column, there is no obvious German miracle during this 13 years.
The second number is labor compensation per hour. This is measured in nominal terms (i.e. current Euros or US dollars or UK pounds) as it should be when talking about competitiveness. One expects that increased productivity gets reflected in increased compensation (in real terms) and in addition we should see the effect of inflation. Here Germany stands out as the country with the lowest wage increase (per hour). To make sense out of this number we should compare it to the increase in productivity as measured by GDP per hour. This is what the third column, the unit labor cost (ULC) does, it is simply equal to the change in labor compensation per hour minus the change in output per hour.
When looking at ULC we see that Germany has seen the lowest increase in labor costs per unit of output but not because of the highest increase in productivity but because of wage moderation relative to productivity gains. Italy and the UK are the countries with the largest increase in ULC through a combination of zero (Italy) or average (UK) productivity gains combined with significant wage growth. This is the German "miracle", the ability to convince workers to get paid less (relative to productivity) than in other countries. This is good news for German firms.
To make the "German miracle" look even stronger we can replicate the same analysis for the pre-crisis period (2000-2007).

Here we can see how Germany was even more of an outlier in terms of ULC. Once again we see wage moderation combined with good productivity growth. We also see that during those years Spain looks much worse than once we add the post-crisis period with lower productivity growth and much higher increase in ULC. Comparing the two charts we can see that there has been a significant adjustment in Spain after the crisis both when it comes to GDP per hour and ULC relative to Germany.
So can low wages be the solution for some of the Euro problems? If the goal is to improve living standards, the focus must be on improving GDP per hour, that is the only way to ensure sustained progress. Having said that, for a given increase in GDP per hour, wage growth has to be consistent with these improvements in productivity so that unit labor costs do not grow too fast, otherwise a country will be pricing itself out of the market (and we will see that in a decline in the number of hours, unemployment)
Finally, the connection between wages and prices is also not as straightforward as some would argue. The numbers for labor compensation above are all in nominal terms, which is the right way to compare labor costs across countries and its relationship to competitiveness in global markets (more so when we compare two Euro countries so we do not need to worry about exchange rates). But the evolution of nominal wages can be very different from the evolution of real wages. Below I reproduce the first chart (excluding the UK) where I adjust wages and ULC for domestic inflation (using CPI).

If we compare Germany to Italy or Spain now we see that real wages did not grow significantly faster in Italy or Spain than in Germany, and this is of their higher inflation. When compared with GDP per hour we could still argue that real wage is high in the case of Italy but it looks as low in Spain as it does in Germany. Notice that when real wages grow slower than GDP per hour it must be that we are seeing a decline in the labor share, so an increase in the capital share. In other words, prices are not only related to labor compensation but also to profits.
In summary, no doubt that wage growth can in occassions be excessive and generate increases in labor costs with negative consequences on labor market outcomes. But insisting on moderation in wage growth regardless of the circumstances as a recipe for growth is not right. First, sustained growth in living standards can only be the result of increases in productivity (otherwise, why don't we just make wages equal to zero to maximize our competitiveness?). Second, what matters for competitiveness is prices and those depend not only on labor costs but also on the pricing power and decisions of firms. Excessive wage growth might be a drag on competitiveness but so can an excessive increase in profits or other forms of rents.
Antonio Fatás
Below is a chart that summarizes data provided by the OECD on productivity, compensation and unit labor costs. I computed the accumulated change from 2000 to 2013 (except for the US where there was no data for 2013, so the period is 2000-2012).
The blue column (real GDP per hour) represents improvements in productivity. This is the ultimate source of sustainable improvements in living standards. What we see is a significant gap between the US and Europe (more so if we consider that the US is 'missing' one year). When we look inside Europe we see a big outlier: Italy, where GDP per hour has barely changed in the last 13 years. There are some interesting differences among the other countries with Spain seeing an 18% increase over the period compared to 15% in Germany and 12-13% in France and the UK. In this first column, there is no obvious German miracle during this 13 years.
The second number is labor compensation per hour. This is measured in nominal terms (i.e. current Euros or US dollars or UK pounds) as it should be when talking about competitiveness. One expects that increased productivity gets reflected in increased compensation (in real terms) and in addition we should see the effect of inflation. Here Germany stands out as the country with the lowest wage increase (per hour). To make sense out of this number we should compare it to the increase in productivity as measured by GDP per hour. This is what the third column, the unit labor cost (ULC) does, it is simply equal to the change in labor compensation per hour minus the change in output per hour.
When looking at ULC we see that Germany has seen the lowest increase in labor costs per unit of output but not because of the highest increase in productivity but because of wage moderation relative to productivity gains. Italy and the UK are the countries with the largest increase in ULC through a combination of zero (Italy) or average (UK) productivity gains combined with significant wage growth. This is the German "miracle", the ability to convince workers to get paid less (relative to productivity) than in other countries. This is good news for German firms.
To make the "German miracle" look even stronger we can replicate the same analysis for the pre-crisis period (2000-2007).
So can low wages be the solution for some of the Euro problems? If the goal is to improve living standards, the focus must be on improving GDP per hour, that is the only way to ensure sustained progress. Having said that, for a given increase in GDP per hour, wage growth has to be consistent with these improvements in productivity so that unit labor costs do not grow too fast, otherwise a country will be pricing itself out of the market (and we will see that in a decline in the number of hours, unemployment)
Finally, the connection between wages and prices is also not as straightforward as some would argue. The numbers for labor compensation above are all in nominal terms, which is the right way to compare labor costs across countries and its relationship to competitiveness in global markets (more so when we compare two Euro countries so we do not need to worry about exchange rates). But the evolution of nominal wages can be very different from the evolution of real wages. Below I reproduce the first chart (excluding the UK) where I adjust wages and ULC for domestic inflation (using CPI).
If we compare Germany to Italy or Spain now we see that real wages did not grow significantly faster in Italy or Spain than in Germany, and this is of their higher inflation. When compared with GDP per hour we could still argue that real wage is high in the case of Italy but it looks as low in Spain as it does in Germany. Notice that when real wages grow slower than GDP per hour it must be that we are seeing a decline in the labor share, so an increase in the capital share. In other words, prices are not only related to labor compensation but also to profits.
In summary, no doubt that wage growth can in occassions be excessive and generate increases in labor costs with negative consequences on labor market outcomes. But insisting on moderation in wage growth regardless of the circumstances as a recipe for growth is not right. First, sustained growth in living standards can only be the result of increases in productivity (otherwise, why don't we just make wages equal to zero to maximize our competitiveness?). Second, what matters for competitiveness is prices and those depend not only on labor costs but also on the pricing power and decisions of firms. Excessive wage growth might be a drag on competitiveness but so can an excessive increase in profits or other forms of rents.
Antonio Fatás
Monday, August 18, 2014
Irrational exuberance meets secular stagnation
Robert Shiller warns us in the New York Times about the potential risks of high stock market valuations in the US. According to Shiller "the United States stock market looks very expensive right now". Brad DeLong and Dean Baker disagree with Shiller and argue that stock prices might look higher than historical averages but this could be ok given other changes in the economic environment.
Here is a restatement of their debate (and I will be repeating arguments I have made before):
Shiller's concern comes from the fact that price-to-earning (PE) ratios in the US are high by historical standards. Using his own measure, they stand at above 25 which is much higher than the 15 level that was common before the massive 2000 bubble that took that ratio all the way to 44. There is no disagreement about this fact.
Where Brad DeLong and Dean Baker disagree is in how relevant history is an indicator of what constitutes the right level for the PE ratio. The easiest way to think about the PE ratio is to first look at its inverse: earnings as a ratio to prices (EP). This gives us a sense on the yield that a share delivers today (let's keep aside for the sake of simplicity the difference between earnings and dividends). But this is just the static return that shares promise. We know that earnings will be higher in the future and the total return will then be the sum of the "static" return (EP) plus the expected growth of earnings.
Using similar numbers to Dean Baker's post, we can see that historically, a PE of about 15 corresponded to an EP of 6.7%. If we add to this real growth of earnings that was not far from the real growth in GDP, so about 3%, we ended up with a historical return of about 9.7% in real terms. How good was 9.7%? It was a good return. In fact, it was so good that many academics were puzzled by how high this level was. The way they expressed this puzzle is by comparing this return to the returns of alternative assets. Bonds paid somewhere below 4% (real) during most of those decades, which means that stocks yielded close to 6% premium over safe assets (this is what economists called the risk premium and because of its high level it led to a very prolific literature trying to explain the "equity premium puzzle").
Today, a PE of 25 translates into an EP of only 4%. This looks low compared to the historical average and that's where Shiller's concerns come from. But there are three potential reasons why the historical average might not be relevant:
1. Returns on other assets have gone down. Here is where secular stagnation meets irrational exuberance. A new eBook released by VoxEU presents convincing evidence in favor of the idea of secular stagnation. Secular stagnation is characterized, among other things, by real interest rates that are very low, possibly negative. But if this is true, it means that an EP of only 4%, which is about 2.7% lower than the historical one can be entirely justified by equilibrium real interest rates (returns) that are significantly lower than historical ones. What used to be a typical real return for bonds of 3-4% is now 0-1% (or even lower). This means that the return of stocks still remains significantly higher than those of other assets by a margin which is not far from historical levels. In other words, what used to be an EP of 6.7% should now an EP of 4%.
2. Not so fast! Secular stagnation also suggests that the growth rate of real GDP (and therefore earnings) is slowing down. This means that while the static EP ratio might look ok, when we factor in the lower growth of GDP we are back to stocks being too expensive. Correct but what matters here is the relative change in interest rates relative to the growth rate of GDP (earnings to be more precise). CBO projections of potential GDP for the US are lower than historical averages by somewhere around 0.5%. In contrast, interest rates are much lower, on the range of 2-4% relative to historical averages. Let's put these two numbers together: let's assume GDP growth slows down from 3% to 2.5%. This means that with an EP of 4%, stocks promise a return of about 6.5%. Much lower than in the past but still about 6% higher than bonds (if we take 0.5% as the real return on bonds). So we have the same risk premium as in the past and stocks are still a great investment even if prices are high relative to earnings. Of course, if you pick a much more pessimistic growth rate and a higher real equilibrium rate then stocks become expensive again (and if you go in the other direction then they become an even better deal).
3. Finally, why should the stock market risk premium be 6%? Is this a reasonable number? It is certainly be a function of the perceived risk of investing in stocks and arguments can be made in both directions. It is indeed very difficult to argue in favor of a particular number here but a historical perspective is useful: we cannot forget the fact that in the past such a high risk premium led to the conclusion that stock markets were undervalued and that investors were too-risk averse.
One final reflection: as much as I am offering support for the reading that Brad DeLong and Dean Baker do of the today's US stock market, we cannot forget that what will really matter is the perception of the market about how all these variables are likely to evolve going forward. And as Shiller argues, "sociology and social psychology" can be more useful in determining the future returns of the stock market than PE calculations or statements on equilibrium interest rates. But one still hopes that in the long run, fundamental analysis will produce a good indicators of rates of returns. But until the long run arrives, hold tight. As Brad DeLong puts it "If you are not in stocks for the long term, your stock portfolio should not consist of money that you cannot afford to lose."
Antonio Fatás
Tuesday, August 12, 2014
The September 2014 recession?
Here is a thought experiment: what if the US economy entered a recession next month? Would it be too early for a recessions? How would it compare to previous recessions? And what stories we would tell to explain why the recession happened?
Let's start counting months using the two phases of the business cycle as defined by the NBER business cycle dating committee. How long is the current expansion? The current expansion started in June 2009, which makes it already 62 months. Compared to all the previous post-WWII expansions it is already above average (60.5 months).

Another way to look at it is to realize that we are only one year away from reaching the length of the previous expansion (73 months). It is true that we are still far from reaching the 92 or 120 months of the previous two, but these were two of the largest expansion the US has ever seen. So for those who like to think about expansions and recessions in terms of length and they have the idea that crisis happen with a "certain" frequency, there would be nothing unusual if a recession started today.
What would be more unusual is the way the economy would look like as it entered a recession. There are no indications of the economy running out of slack (inflation, wage growth). It would also be very hard to find large financial excesses as we saw at the end of the 90s (the stock market reached price-earning ratios that are a lot higher than what we see today) or something similar to the large increase in investment in real estate in addition to highly overvalued housing prices that we saw in the years prior to the December 2007 recession. We could of course argue that the recession happened because of geopolitical uncertainty but any historical analysis of political events over the last decades would suggest that what we are seeing today (so far, keeps fingers crossed) is not that unusual.
And if a recession started today, one pattern that would also be very different is the stance of monetary policy. If we measure it by the difference between long-term and short-term rates we typically see that this difference displays a strong and consistent downward trend as we approach a recession, something that we have not seen at all in recent months (or years). Here is a quick comparison of the difference between 10 year and 3 month interest rates for the average of the last four recessions compared to what the data would look like for a recession starting today.


Let's start counting months using the two phases of the business cycle as defined by the NBER business cycle dating committee. How long is the current expansion? The current expansion started in June 2009, which makes it already 62 months. Compared to all the previous post-WWII expansions it is already above average (60.5 months).
Another way to look at it is to realize that we are only one year away from reaching the length of the previous expansion (73 months). It is true that we are still far from reaching the 92 or 120 months of the previous two, but these were two of the largest expansion the US has ever seen. So for those who like to think about expansions and recessions in terms of length and they have the idea that crisis happen with a "certain" frequency, there would be nothing unusual if a recession started today.
What would be more unusual is the way the economy would look like as it entered a recession. There are no indications of the economy running out of slack (inflation, wage growth). It would also be very hard to find large financial excesses as we saw at the end of the 90s (the stock market reached price-earning ratios that are a lot higher than what we see today) or something similar to the large increase in investment in real estate in addition to highly overvalued housing prices that we saw in the years prior to the December 2007 recession. We could of course argue that the recession happened because of geopolitical uncertainty but any historical analysis of political events over the last decades would suggest that what we are seeing today (so far, keeps fingers crossed) is not that unusual.
And if a recession started today, one pattern that would also be very different is the stance of monetary policy. If we measure it by the difference between long-term and short-term rates we typically see that this difference displays a strong and consistent downward trend as we approach a recession, something that we have not seen at all in recent months (or years). Here is a quick comparison of the difference between 10 year and 3 month interest rates for the average of the last four recessions compared to what the data would look like for a recession starting today.
The average of the past 4 recessions shows that the interest rate difference displays a steady downward trend towards zero in the quarters that precede the recession. And if you want more details, here is the data for those 4 recessions (I am removing the July 1981 recession because the expansion before was too short to say anything meaningful).
While there are some differences across each of the cycles, they all share the same overall trend. We have not seen any of this pattern over the last quarters or years. The difference between 10 year and 3 month interest rate remains flat. And while it is possible that short term interest rates are about to start increasing in the US, it is very likely that when they do we also see increases in the 10-year rate. So if this was a typical cycle, we are far from seeing a flat or downward-slopping yield curve.
So what would a US recession today do to our understanding of business cycles? While it would not be a large surprise in terms of how soon it happened relative to the previous one, it would open many questions about the reasons why recessions happen and about the behavior of interest rates and monetary policy around the turning point of the cycle. It would be yet another "new normal", this time for business cycles.
Antonio Fatás
Sunday, August 10, 2014
ECB needs to talk about slack and not structural reforms
In today's Financial Times, Matteo Renzi, Italy's primer minister defends the pace of Italian reforms. In doing so he responds to comments by Mario Draghi last week that the pace of structural reform in Italy was responsible for the low GDP growth figures. From the FT interview:
I agree with Draghi when he says that Italy needs to make reforms but how we are going to do them.
So no disagreement between Draghi and Renzi on the need for structural reforms in Italy. The fact that improvements in regulation, labor markets, competition can increase growth rates in Europe is undisputed. The real debate is about the right timing and speed of those reforms. Here Renzi disagrees with Draghi.
I will decide, not the Troika, not the ECB, not the European Commission,” he said. “I will do the reforms myself because Italy does not need someone else to explain what to do.”
But beyond the question of who decides on what are the appropriate reforms and at what pace they should be done, I find that there is a more fundamental problem with the dialogue between central banks and governments about the need of reforms. Why do central bankers need to remind governments of the need to do reforms? The only reason I can think of is because they feel too much pressure to lift growth rates and they want to explain to the public at large that the low economic performance is not really their fault but the fault of governments' failure to reform. But I find that the way the argument is being made creates unnecessary confusion and leads to a behavior of the central bank that sounds defensive and a justification for inaction.
Clearly, during any period of low growth there is a debate about the extent to which this is due to cyclical conditions or structural ones. What I expect the central bank to communicate is their view on how close the economy is to potential output, how much slack there is in the economy and how they plan to use their economic tools to address that gap. In the ECB press conference last Thursday, Draghi acknowledged that some of the low growth in Italy (and Europe) is due to demand/cyclical factors. But then he immediately brought up the need for structural reforms. And when he had to compare the importance of the two arguments in the case of Italy, he said that "it's mostly the lack of structural reforms" instead of low expected demand that is keeping investment low. I would find more reassuring if Draghi provided a stronger and more quantitative statement on the perceived slack in the economy (or the deviations of inflation from its target) and what the ECB plans to do about it than trying to guess the potential effects of structural reform.
The contrast between the ECB and the US Fed is, as usual, very interesting. The statements from the FOMC in the US tend to focus on their views about the current slack in the labor market and the potential effects of monetary policy actions to address this slack. There can be an occasional (justified) comment on how fiscal policy conditions are affecting the cyclical position of the US economy. No mention on the potential role of other long-term growth-enhancing policies that could be undertaken in the US government, as it should be.
Antonio Fatás
Thursday, August 7, 2014
A recession without a boom?
Simon Wren-Lewis in one of his latests posts dismisses the idea that the pre-recession UK economy was in an unsustainable debt-fueled boom. The argument, which I have made before in earlier posts, is that focusing only on the path of debt can give a misleading picture of the sustainability of growth or spending. Wren-Lewis presents data for the UK showing that the large increase in debt in the UK prior to 2007 was matched by an increase in the value of the assets that UK households held so that net wealth was indeed increasing (despite the increase in borrowing). The role of housing prices is key to understand these developments. Wren-Lewis argues that in the case of the UK, because of a combination of lower interest rates and limited supply, housing prices are trending upwards.
The simplest way to understand the argument is to think about two alternative scenarios when it comes to the purchase of housing services: renting versus borrowing to buy the house (no rent is paid in the future but mortgage payments will have to cover the cost of borrowing).
In the first scenario, there is no debt, in the second one there is an increase in debt. In what sense the presence of debt makes the second scenario or decision more unsustainable than the first one? One could argue that because of the ownership of the asset, there is the possibility of decreases in asset prices that could result in financial pressure and need to reduce other spending. Correct, but the same could be argued in the first scenario where a potential increase in the price of houses (and rents) will reduce the after-rent income for the household and will result in the same need to reduce other forms of spending (there will be no need to "deleverage" but the need to cut other expenditures will be identical). There are, of course, differences in terms of the ability to adjust to shocks because of the illiquidity of housing as an asset, but fundamentally there is a great deal of symmetry where ownership of the asset will give up potential returns if the asset price goes up but risks if it goes down while renting will exposes you to a risk of increases in rents if housing prices go up.
What can make the analysis more difficult is the heterogeneity across agents. Housing happens to be a special asset where it is mostly held to enjoy the services that it provides. In addition, we are all somehow exposed to fluctuations in housing prices because we either rent or buy the asset. This means that when we think about an individual scenario of renting we cannot forget that someone else owns the asset. This can in some cases reduce the aggregate risk as increases in prices benefit owners but hurt renters but the aggregate effects can depend on the characteristics of the individuals who are exposed to different risks. For example, while aggregate net wealth today in the US is higher than before the crisis (according to the US Federal Reserve flow of funds database), this fact hides strong difference across different households as there is evidence of increased wealth inequality during that period using alternative datasets. And this heterogeneity could have aggregate consequences because of differences in accessing to financing or spending patterns. But in this case the story is more complex than the notion of a country living beyond its means through a borrowing spree.
So increases in debt alone cannot be interpreted as a definite signal that the economy is in an unsustainable boom. But we might not rule out either that it might be a reflection of other economic trends that can put growth at risk. in particular when we take into account the heterogeneity of agents. Unfortunately the lack of available disaggregated data as well as solid and accepted theoretical models with heterogeneous agents make this analysis a lot more speculative.
Antonio Fatás
Thursday, June 26, 2014
Addicted to central bank painkillers?
Claudio Borio (BIS) and Piti Disyatat write about the dangers of low interest rates at VoxEU. Using an argument that has been put forward many times by the BIS (Claudio Borio and co-authors), low interest rates during booms and expansions can create bubbles and financial instability. Central banks need to be aware of the costs of low interest rates.
The authors, while accepting the idea that low real interest rates might be the outcome of low growth and secular stagnation, argue that central banks cannot simply be seen as passive agents adapting their policies to the macroeconomic environment; they are responsible for low interest rates. In their words "money and finance are not neutral". Quoting from the article:
"Not only can financial factors – especially leverage – amplify cyclical fluctuations, but they can also propel the economy away from a sustainable growth path. By influencing decisions to invest, variations in financial conditions affect the evolution of the capital stock, and hence, future economic fundamentals. An expanding capital stock during booms may help to constrain inflation and obviate the perceived need for monetary-policy tightening. At the same time, large changes in relative prices that typically occur in financial booms divert resources into surging sectors in ways that are not easily reversible. The long-lasting impact of the financial cycle becomes especially evident in the bust phase. The cumulative build-up in debt and associated resource misallocations – especially the overhang of capital – leave a legacy that takes time to resolve."
To support their claim, the authors produce a chart that shows how debt (public and private) has increased dramatically during the years where interest rate were coming down.

Their conclusion:
"More stimulus may boost output in the short run, but it can also exacerbate the problem, thus compelling even larger dosages over time. An unhealthy dependence on painkillers can be avoided, but only if we recognise the risk in time."
I have no objection to the idea that money and finance are not neutral and that central banks can have an important role in financial markets. But the analysis above is too simplistic and potentially misleading.
The logic it puts forward is that arbitrarily-low interest rates set by the central bank generate an unsustainable behavior in terms of accumulation of debt that is behind the bubbles we built in the good years and the crisis that resulted from the bursting of those bubbles.
What is always missing in this analysis is the fact that the world is a closed system. The debt that appears in the chart above has to be bought by someone. Those liabilities are assets for someone else. Who are the buyers? And who "forces" them to buy those assets at that price/yield?
Before we continue any further let's rule out the hypothesis that it is the central bank who is buying those assets. The easiest way to understand that it cannot be the central bank is that the chart above starts a lot earlier than the time when central banks' balance sheets started to increase (the second reason is that for every asset that the central bank buys it issues a liability but this will get us to a more complicated argument).
There is a simpler way to explain the chart above. A shift in the supply of saving by some agents/countries resulted in a decrease of interest rates and an increase in borrowing by the rest of the world. Some of this happens within countries, some happens across countries. This could still be an unsustainable development as borrowers go too far and lenders do not understand the risk involved but it is not simply be caused by the irresponsible policies of the central bank.
It could also be that, in addition, we have seen a significant increase in gross flows of assets and liabilities that do not result in a change in equity or net wealth but that they lead to an increase in the size of balance sheets across agents (i.e. increased leverage). Simplest example is households buying real estate with mortgages but it can also be financial institutions increasing leverage. This increases debt but it increases assets as well. This, once again, can generate instability but the borrowing that we see must come from somewhere else in the economy (not the central bank). Understanding that side of the balance sheet is important to have a complete story of what caused the crisis and what it takes to get out of it.
Antonio Fatás
The authors, while accepting the idea that low real interest rates might be the outcome of low growth and secular stagnation, argue that central banks cannot simply be seen as passive agents adapting their policies to the macroeconomic environment; they are responsible for low interest rates. In their words "money and finance are not neutral". Quoting from the article:
"Not only can financial factors – especially leverage – amplify cyclical fluctuations, but they can also propel the economy away from a sustainable growth path. By influencing decisions to invest, variations in financial conditions affect the evolution of the capital stock, and hence, future economic fundamentals. An expanding capital stock during booms may help to constrain inflation and obviate the perceived need for monetary-policy tightening. At the same time, large changes in relative prices that typically occur in financial booms divert resources into surging sectors in ways that are not easily reversible. The long-lasting impact of the financial cycle becomes especially evident in the bust phase. The cumulative build-up in debt and associated resource misallocations – especially the overhang of capital – leave a legacy that takes time to resolve."
To support their claim, the authors produce a chart that shows how debt (public and private) has increased dramatically during the years where interest rate were coming down.
Their conclusion:
"More stimulus may boost output in the short run, but it can also exacerbate the problem, thus compelling even larger dosages over time. An unhealthy dependence on painkillers can be avoided, but only if we recognise the risk in time."
I have no objection to the idea that money and finance are not neutral and that central banks can have an important role in financial markets. But the analysis above is too simplistic and potentially misleading.
The logic it puts forward is that arbitrarily-low interest rates set by the central bank generate an unsustainable behavior in terms of accumulation of debt that is behind the bubbles we built in the good years and the crisis that resulted from the bursting of those bubbles.
What is always missing in this analysis is the fact that the world is a closed system. The debt that appears in the chart above has to be bought by someone. Those liabilities are assets for someone else. Who are the buyers? And who "forces" them to buy those assets at that price/yield?
Before we continue any further let's rule out the hypothesis that it is the central bank who is buying those assets. The easiest way to understand that it cannot be the central bank is that the chart above starts a lot earlier than the time when central banks' balance sheets started to increase (the second reason is that for every asset that the central bank buys it issues a liability but this will get us to a more complicated argument).
There is a simpler way to explain the chart above. A shift in the supply of saving by some agents/countries resulted in a decrease of interest rates and an increase in borrowing by the rest of the world. Some of this happens within countries, some happens across countries. This could still be an unsustainable development as borrowers go too far and lenders do not understand the risk involved but it is not simply be caused by the irresponsible policies of the central bank.
It could also be that, in addition, we have seen a significant increase in gross flows of assets and liabilities that do not result in a change in equity or net wealth but that they lead to an increase in the size of balance sheets across agents (i.e. increased leverage). Simplest example is households buying real estate with mortgages but it can also be financial institutions increasing leverage. This increases debt but it increases assets as well. This, once again, can generate instability but the borrowing that we see must come from somewhere else in the economy (not the central bank). Understanding that side of the balance sheet is important to have a complete story of what caused the crisis and what it takes to get out of it.
Antonio Fatás
Monday, June 9, 2014
Is liquidity stuck at banks?
Last week the ECB announced new monetary policy actions to help restore growth in the Euro area and bring inflation closer to its 2% target. Interest rates were reduced and further provision of loans to commercial banks were announced. In addition, there is a plan to implement purchases of asset based securities.
The effectiveness of recent monetary policy actions by central banks has been met with some skepticism because it does not deliver the necessary increase in lending to the private sector. While liquidity is introduced, it seems to get stuck in the accounts that the commercial banks hold at the central bank (reserves). Because of this, both the Bank of England and now the ECB are implementing injections of liquidity that are linked to increased lending to the private sector by the financial institutions that are borrowing that liquidity.
The role that reserves play in the recent monetary policy actions by the ECB leads some times to confusion. Some seem to think that the high level of reserves that banks hold is a measure of the failure of central banks to generate additional loans to the private sector. The logic is that reserves stay high because of the lack of willingness to lend. This is the wrong view of reserves, they cannot simply be seen as resources that are waiting to be provided as loans to the private sector.
Reserves are a liability in the central bank balance sheet that it is created when the central bank decides to allocate more loans to commercial banks or when it decides to buy securities. If a commercial bank decides to give a loan to one of its customer (household or business), the reserves do not disappear. Once that customer uses its loan for a purchase, these reserves are transferred from one commercial bank to another, but the level of reserves remains constant.
How can reserves go down? In the case of the ECB, most of the injections in liquidity have been done via loans to commercial banks. Reserves will only go down when commercial banks pay back their loans with the central bank (or when the central bank decides to reduce the amount of loans it provides as some of the outstanding ones are repaid). So any increase in the provision of loans by the ECB will lead to an increase in reserves. Below are the two series: loans to commercial banks (an asset for the ECB) and reserves of commercial banks at the ECB (a liability at the ECB). Both series are in Billions of Euros (Source: ECB).


The evolution of both series is identical. The large increase in loans (LTROs) that started in the Fall of 2011 led to a large increase in reserves. Since then, both series have been coming down as Euro commercial banks have been repaying their loans (voluntarily). So the balance sheet of the ECB has been shrinking dramatically over the last months. The new wave of loans announced by Mario Draghi is likely to increase both series again (although by how much will depend on how Euro financial institutions feel the need to tap into additional ECB funding).
The fact that the two series move together does not mean that the actions of the central bank are ineffective. It is possible that the availability of funding for some banks leads them to provide more loans to the private sector. What one cannot do is judge the success of these actions by the level of reserves in the financial system. The level of reserves will not change when the private loans are given.
As a point of comparison, the profile of the series above for the US Federal Reserve is very different: they keep trending up, no decrease at all. The reason is that the US central bank has increased its balance sheet by buying securities. So reserves are created agains the purchase of those securities. In this case, the level of reserves is even more directly linked to the actions of the central bank. It is only when the central bank decides to sell those securities that the level of reserves will come down. And this is the new step that Draghi has promised in his press conference last week, the ECB is willing to engage in true quantitative easing via the purchase of asset based securities.
Antonio Fatás
The effectiveness of recent monetary policy actions by central banks has been met with some skepticism because it does not deliver the necessary increase in lending to the private sector. While liquidity is introduced, it seems to get stuck in the accounts that the commercial banks hold at the central bank (reserves). Because of this, both the Bank of England and now the ECB are implementing injections of liquidity that are linked to increased lending to the private sector by the financial institutions that are borrowing that liquidity.
The role that reserves play in the recent monetary policy actions by the ECB leads some times to confusion. Some seem to think that the high level of reserves that banks hold is a measure of the failure of central banks to generate additional loans to the private sector. The logic is that reserves stay high because of the lack of willingness to lend. This is the wrong view of reserves, they cannot simply be seen as resources that are waiting to be provided as loans to the private sector.
Reserves are a liability in the central bank balance sheet that it is created when the central bank decides to allocate more loans to commercial banks or when it decides to buy securities. If a commercial bank decides to give a loan to one of its customer (household or business), the reserves do not disappear. Once that customer uses its loan for a purchase, these reserves are transferred from one commercial bank to another, but the level of reserves remains constant.
How can reserves go down? In the case of the ECB, most of the injections in liquidity have been done via loans to commercial banks. Reserves will only go down when commercial banks pay back their loans with the central bank (or when the central bank decides to reduce the amount of loans it provides as some of the outstanding ones are repaid). So any increase in the provision of loans by the ECB will lead to an increase in reserves. Below are the two series: loans to commercial banks (an asset for the ECB) and reserves of commercial banks at the ECB (a liability at the ECB). Both series are in Billions of Euros (Source: ECB).
The evolution of both series is identical. The large increase in loans (LTROs) that started in the Fall of 2011 led to a large increase in reserves. Since then, both series have been coming down as Euro commercial banks have been repaying their loans (voluntarily). So the balance sheet of the ECB has been shrinking dramatically over the last months. The new wave of loans announced by Mario Draghi is likely to increase both series again (although by how much will depend on how Euro financial institutions feel the need to tap into additional ECB funding).
The fact that the two series move together does not mean that the actions of the central bank are ineffective. It is possible that the availability of funding for some banks leads them to provide more loans to the private sector. What one cannot do is judge the success of these actions by the level of reserves in the financial system. The level of reserves will not change when the private loans are given.
As a point of comparison, the profile of the series above for the US Federal Reserve is very different: they keep trending up, no decrease at all. The reason is that the US central bank has increased its balance sheet by buying securities. So reserves are created agains the purchase of those securities. In this case, the level of reserves is even more directly linked to the actions of the central bank. It is only when the central bank decides to sell those securities that the level of reserves will come down. And this is the new step that Draghi has promised in his press conference last week, the ECB is willing to engage in true quantitative easing via the purchase of asset based securities.
Antonio Fatás
Thursday, May 22, 2014
The US labor market is not working.
In a recent post Paul Krugman looks at the dismal performance of US labor markets over the last decade. To make his point, he compares the employment to population ratio for all individuals aged 25-54 for the US and France. The punch line: even the French work harder than the Americans! And this is indeed a new phenomenon, it was not like that 13 years ago [Just to be clear, there are other dimensions where the French are not working as hard: they retire earlier, they take longer vacations,... but the behavior of the 25-54 year old population is indeed a strong indicator of how a society engages its citizens in the labor market. ]
So are the French the exception? Not quite. Among OECD economies, the US stands towards the bottom of the table when it comes to employment to population ratio for this cohort (#24 out of 34 countries).

What is interesting is that most of the countries of the top of the list are countries with a large welfare state and very high taxes (including on labor). So the negative correlation between the welfare state and taxes and the ability to motivate people to work (and create jobs) that some bring back all the time does not seem to be present in the data.
What is interesting is that the US looked much better 13 years ago (see numbers for 2000 below, the US was 10 out of 34).

The US has gone through a major crisis after 2008 with devastating effects on the labor market but so have other countries. In fact, most European countries have done much worse than the US in terms of GDP growth during the last 6 years. In fact, with the exception of Portugal, Greece and Ireland, the US is the country with the worst labor market record for this age group if we compare the 2012 to the 2000 figures.

Antonio Fatás
So are the French the exception? Not quite. Among OECD economies, the US stands towards the bottom of the table when it comes to employment to population ratio for this cohort (#24 out of 34 countries).
What is interesting is that the US looked much better 13 years ago (see numbers for 2000 below, the US was 10 out of 34).
The US has gone through a major crisis after 2008 with devastating effects on the labor market but so have other countries. In fact, most European countries have done much worse than the US in terms of GDP growth during the last 6 years. In fact, with the exception of Portugal, Greece and Ireland, the US is the country with the worst labor market record for this age group if we compare the 2012 to the 2000 figures.
Antonio Fatás
Monday, May 12, 2014
Groundhog day (ECB).
For the last months the press conferences of Mario Draghi at the ECB have felt very repetitive. The argument has always been the same: inflation is below target and this might be a risk. But there is uncertainty and there are other risks so let's wait for more data. But when more data arrives, confirming that inflation is below the target, there is no action being triggered and we simply start a new period of waiting for yet more data. Here is my quick search for this pattern in the speeches and Q&A from the last eight months press conferences.
October 2013:
May 2014
It is hard to know how much the wait-and-see attitude of the ECB is a sign of a compromise to acknowledge the threat of low inflation even if there is no consensus on how to deal with it or a truly cautious approach to dealing with challenging economic times. In either case, the actions and even language of the ECB stand in sharp contrast with those of the US Fed.
Antonio Fatás
October 2013:
... and are ready to consider all available instruments.November 2013
... but there are a whole range of instruments that we can activate, if needed.December 2013
... and are ready to consider all available instruments.
January 2014
... and to take further decisive action if required.
February 2014
... and to take further decisive action if required.
March 2014
... and to take further decisive action if required.
April 2014
... and act swiftly if required.
... and act swiftly, if required.So it was back in October when the ECB moved from the (forward guidance) statement of interest rates remaining low for a long period of time to explicitly mentioning the possibility of further actions where all available instruments would be considered. Since then, only the words have changed: notice that in the last two months they are willing to act swiftly while before they were willing to take further decisive actions (in both cases only if required).
It is hard to know how much the wait-and-see attitude of the ECB is a sign of a compromise to acknowledge the threat of low inflation even if there is no consensus on how to deal with it or a truly cautious approach to dealing with challenging economic times. In either case, the actions and even language of the ECB stand in sharp contrast with those of the US Fed.
Antonio Fatás
Subscribe to:
Posts (Atom)